Table Views
The table view in bilabl organizes data into rows and columns, making it easy to manage and view information. As the default view modes, it’s available for all views, allowing you to sort, filter, and work with large datasets. You can explore more detailed here. In addition, you can also customize the table view with settings like column adjustments, sorting, and setting display options.
Table view setting
Using the table view settings, you can show or hide columns with the needed data and rearrange the columns in your preferred order or more organized layout.
To turn on or hide the columns, please follow the steps below.
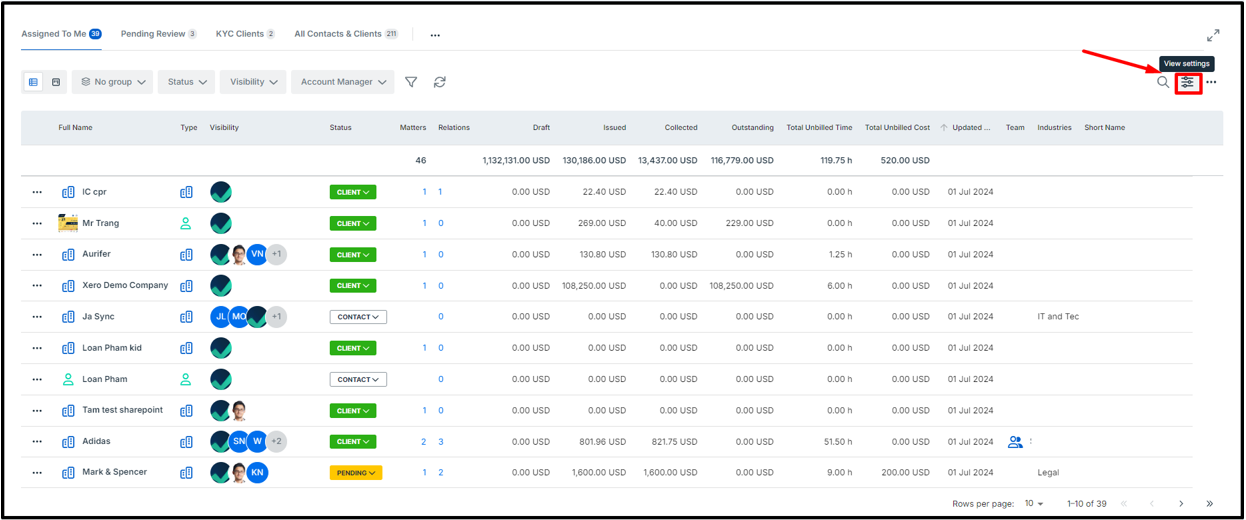
- On the table view, click on the view setting
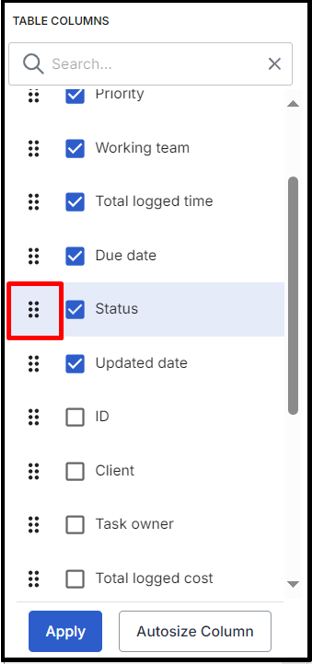
- Tick on the column which you want to be visible or untick on the item if you want to hide this. Then, click Apply to save your action.
Besides, you can rearrange columns by holding and dragging them up or down to place them in your preferred order.
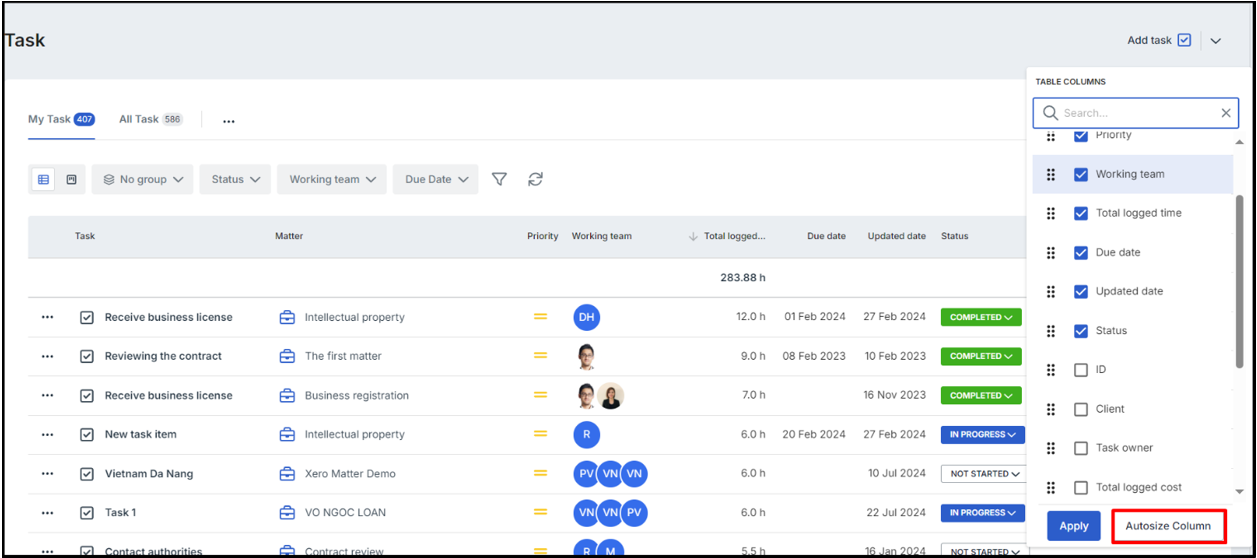
Additionally, in the view settings, you can easily arrange columns for a tidy layout by using the "Autosize Column" option. Click on "Autosize Column," and the system will adjust the columns to fit neatly in the available space.
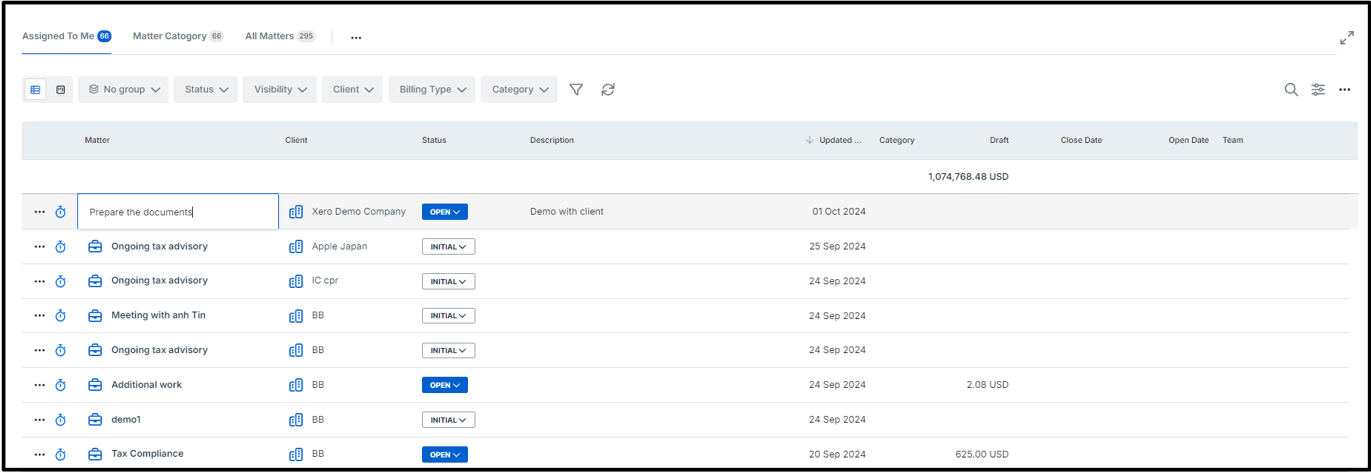
Inline edit
You can change or update the information of each row directly in the table view using our inline edit function. This allows you to make quick adjustments without navigating to the detailed view of each entry. This feature helps streamline data management, saving time by eliminating the need for multiple steps to update individual records.
To inline edit the information on the table views, please follow the steps below:
- On the table view, locate the row with the field you wish to modify.
- Click on the specific field, and it will become editable, indicated by the appearance of a pencil icon.
- Make the necessary changes to the field.
- Once you're done, the changes will be automatically saved when you click outside the field or press the Enter key.
However, some fields are not editable due to data integrity and permission restrictions. As a result, the inline edit feature is only available for fields with the pencil icon where you have the necessary permissions.
Table view configuration
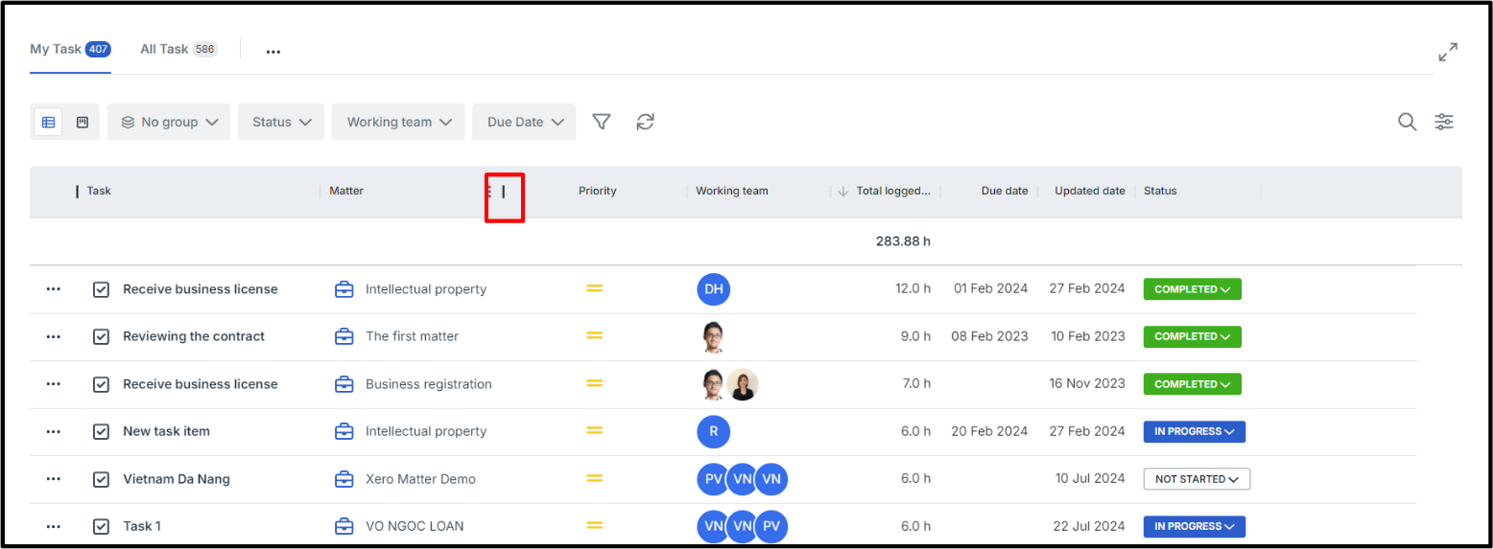
Change the width of the columns
You can adjust column widths to fit your needs by hovering over the line between two columns, waiting for the cursor to change to a resize icon, and then dragging the boundary to your preferred width.
Pinning columns
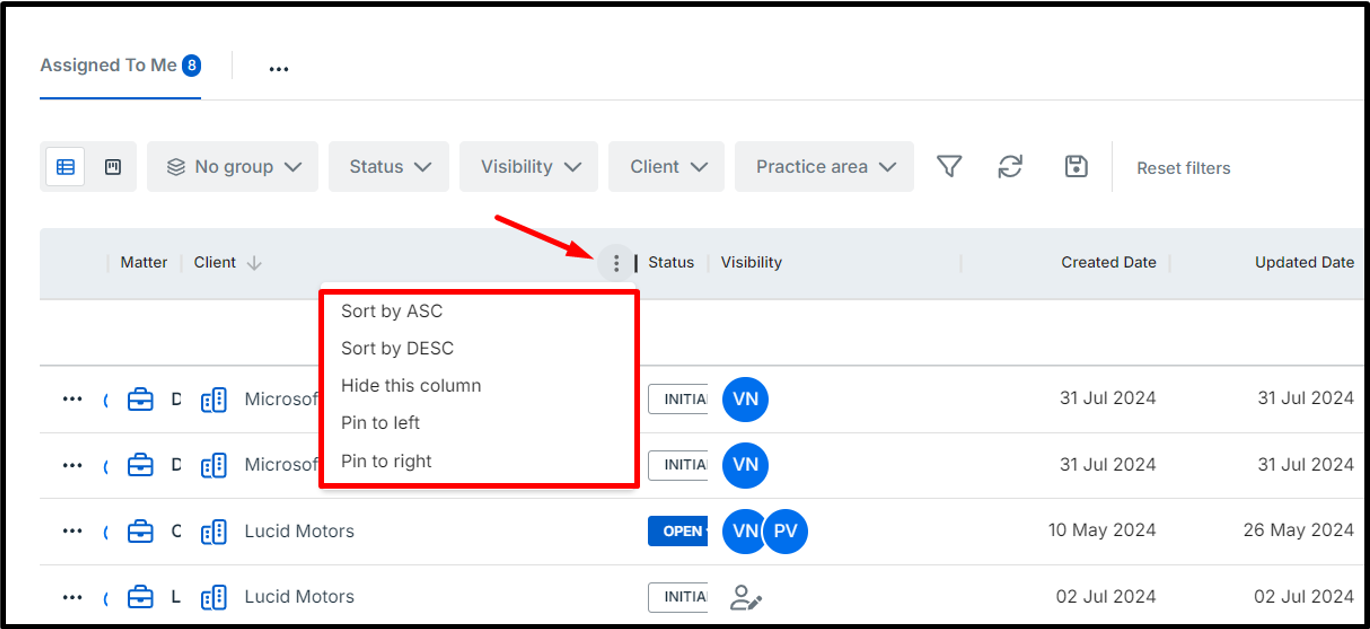
Pinning columns keeps them fixed in place while you scroll through your data. To pin a column to the left or right, hover over the column, click the options icon, and choose "Pin to Left" or "Pin to Right."
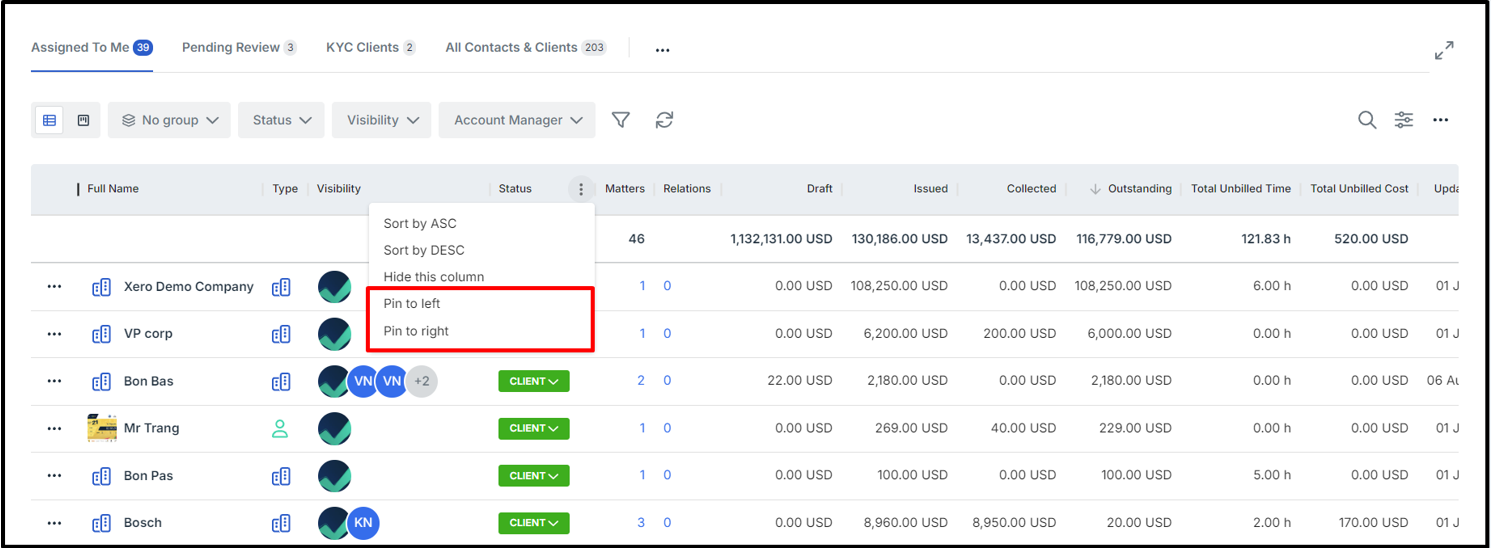
In case you would like to unpin this column, simply choose the column option icon, and select unpin.
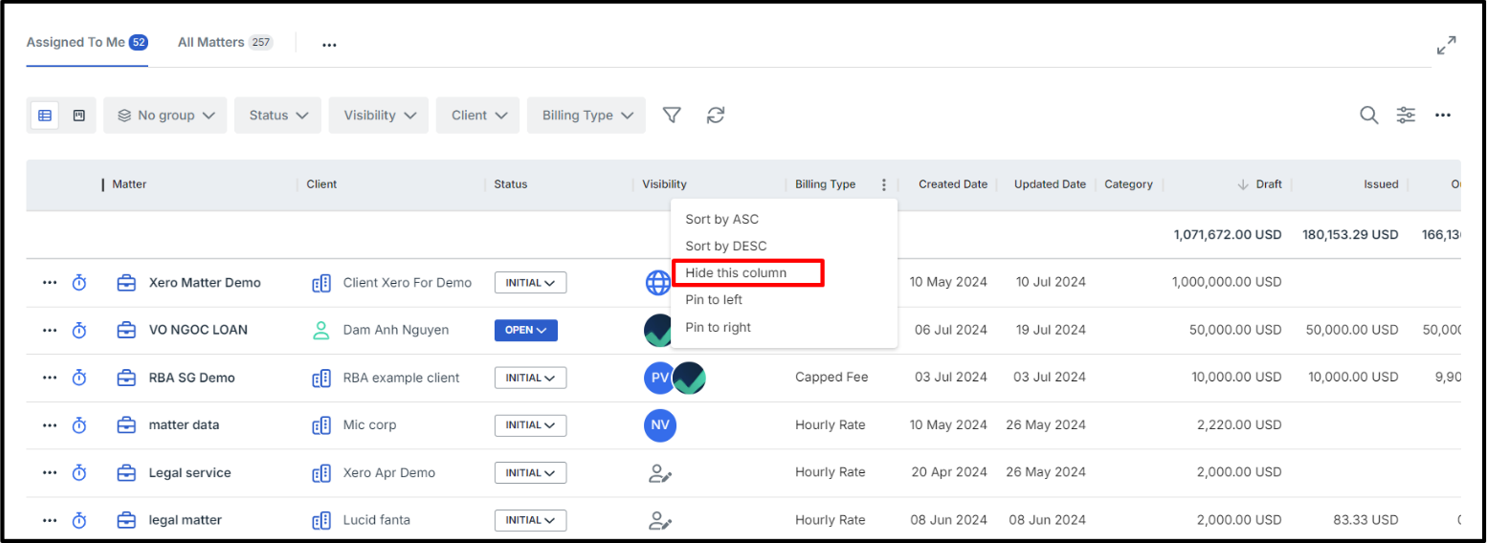
Hide the column
To focus on relevant data, you can temporarily hide specific columns in two ways:
- You can hide one or multiple columns by accessing the table view settings.
- To hide a single column, right-click on the column header you want to hide and select "Hide this column."
To unhide the columns, please click on the table view setting and select your expected unhide column again.
Sorting
You can easily organize your data on bilabl by sorting it to fit your needs.
- Sorting by ASC: This arranges items in ascending order, like numbers from smallest to largest, or text alphabetically from A to Z or date from oldest to latest.
- Sorting by DESC: This arranges items in descending order, like numbers from largest to smallest, or text from Z to A or date from latest to oldest.
To sort your data, just click on the column menu and select either ASC or DESC.
Adjusting rows displayed per page
In bilabl, by default the system only displays 20 rows per page, you can customize the number of rows displayed per page and easily navigate through your data.
In the table view, choose to display 10, 20, 50, or 100 rows per page by selecting an option at the bottom of the table. To quickly access specific data, use the “Next page” or “Last page” buttons to move through the table efficiently.
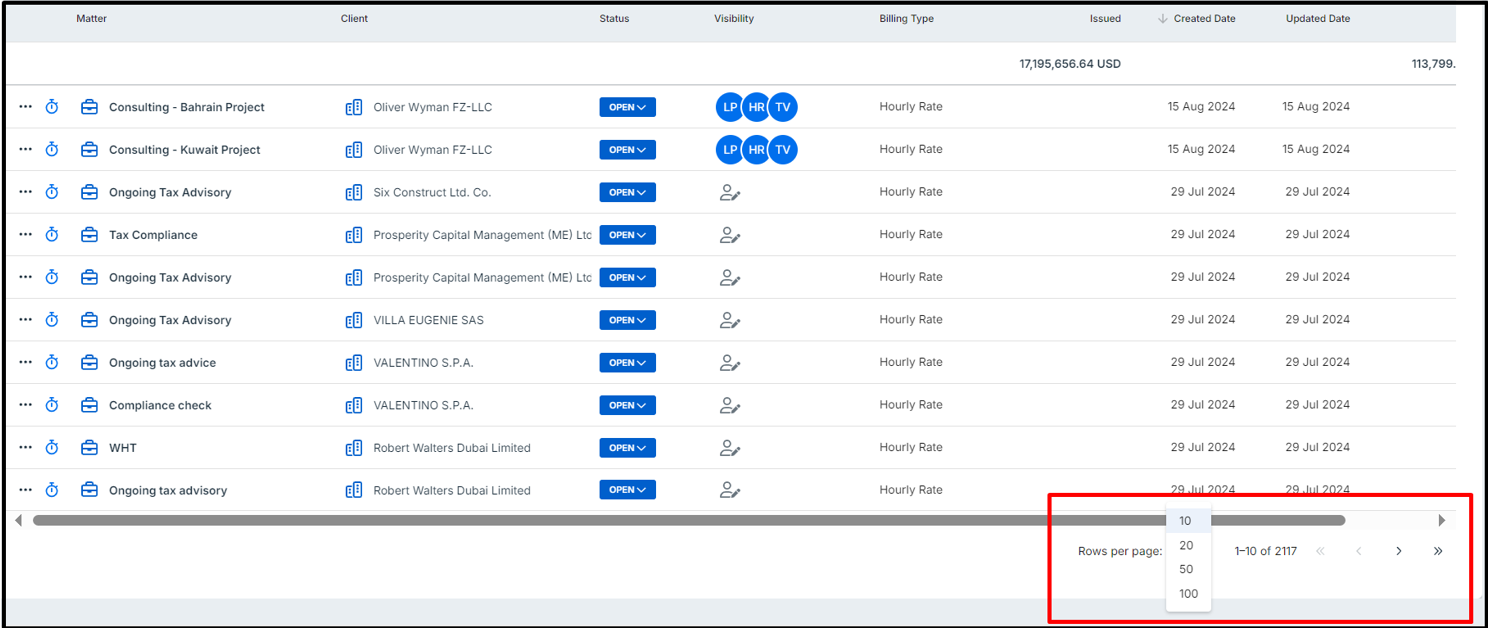
The system will display the rows per page option that is closest to and higher than your total number of rows. For example, if your total number of rows is 21, the system will offer the nearest option, which is 50 rows per page.
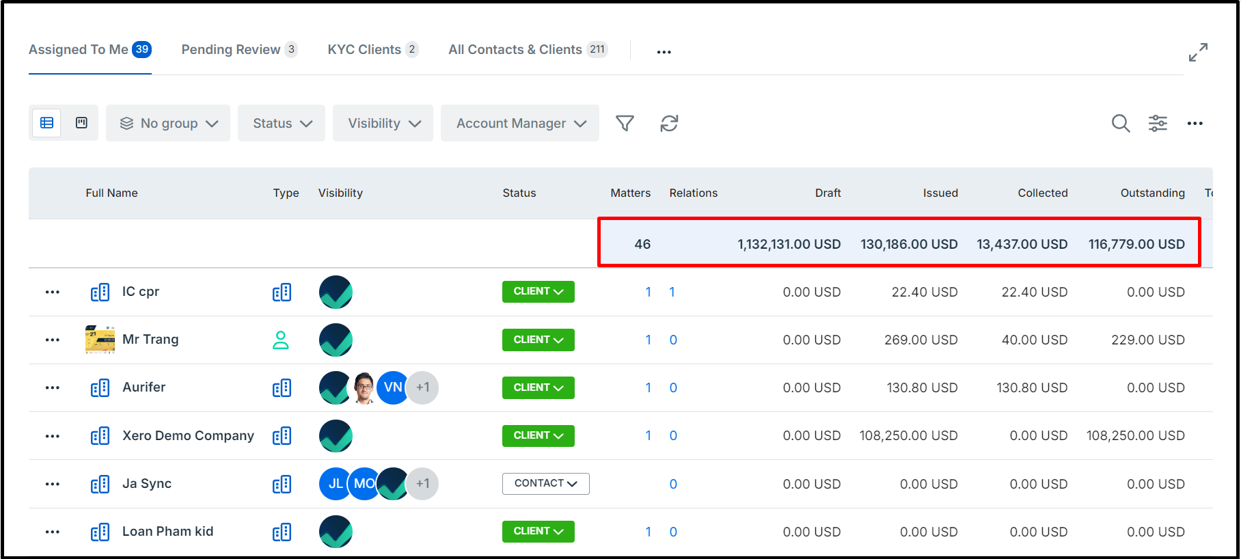
In addition. Table views often display summary information. This includes the total value for each column, providing a quick overview of the data.