Time Utilization report
In this article
This guide helps you use the Time Utilization Report to monitor workforce efficiency and productivity for individuals or teams in legal services. The report tracks utilization, realization, and collected rates to provide insights into time management, performance trends, and areas for improvement, enabling better operational efficiency.
Access to the report depends on your user role, with default permissions set as follows:
- Admin, Manager, Accountant: Full visibility of data for all clients.
- Team Leader: Limited to data for clients assigned to your team.
- User: Restricted to your own data only.
Accessing the report
The Time Utilization Report can be accessed in two ways: as a full detailed report or a summary view on your dashboard.
Full detailed report
To access the full version of the report, follow these steps:
- Navigate to the Reports section.
- Locate and select the Time utilization report.

Dashboard widget (summary view)
To access the general version of the report, follow these steps:
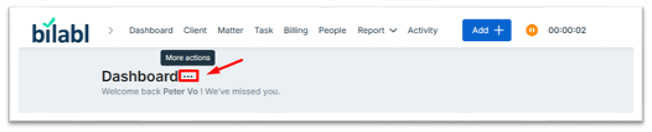
- On your dashboard, click on More Options.
- In the Manage Widget window, navigate to the Time utilization report.
- Enable the report and click Save to apply the changes.

Once added, the report will be accessible directly from your dashboard.
Tip: Drag and drop widgets to customize your dashboard layout for quick access.
Understand the Report Sections
The widget is divided into three sections:
1 - Overview: Displays a high-level summary of key metrics:
- Utilization Rate
- Realization Rate
- Collected Rate
2 - Trending chart
Features an interactive line graph showing billable, non-billable, untracked hours, and target performance over a selected date range.
2 - Report detail: Provides in-depth performance data at the user or team level.
Pie chart
Offers a visual breakdown of key performance indicators (Utilization Rate, Realization Rate, Collected Rate) for a custom date range.

Utilization rates
The percentage of billable hours out of total work hours. It measures time spent on revenue-generating tasks versus the total activities. A higher rate reflects a focus on client service and income generation.
- Formula: Total billable hours / total work hours
- Example: User Lê Hoàng Tâm has a 5.6% utilization rate (0.45 hours), indicating low billable activity allocation.
Realization rates
The percentage of billable hours actually billed to clients. It shows billing efficiency and client payment willingness. A higher rate suggests confidence in billing practices.
- Formula: Total billed hours / total billable hours
- Example: User Lê Hoàng Tâm has a 50.4% realization rate (approximately 0.23 hours per workday), meaning about half of billable time is billed.
Collected rates
The percentage of billed hours paid by clients. It measures revenue collection success, with higher rates indicating effective follow-up.
- Formula: total collected hours / total billed hours
- Example: User Lê Hoàng Tâm has a 58.5% collected rate (0.13 hours per workday), showing strong revenue performance.
Customize report views
- Time Period: Defaults to Year-to-Date. Adjust the timeframe to analyze different periods.
- Filters: Narrow down data by clients, teams, or users to focus on relevant information. By default, all client data is displayed unless filtered.
Trending chart
This section visualizes time allocation across billable, non-billable, and untracked activities, with a target line for comparing billable hours to goals. It helps monitor performance and identify trends.
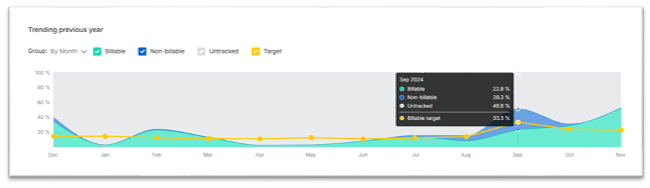
Time categories
- Green: billable time charged to the clients.
- Blue: non-billable hours that will not be charged to clients.
- Gray: untracked or missing hours not logged in the system.
- Yellow: Billable hour goal set in the user profile. The yellow line represents your billable hour target for performance comparison
Tooltip summary
Hover over any data point on the chart to view a tooltip with a detailed summary for that period. For example, hovering over a month might show 48.8% untracked time, indicating missing time logs that need follow-up action.
Customize report views
- Grouping: Group data by week (default), month, quarter, or year.
- Filters: Enable or disable categories (billable, non-billable, untracked) to focus on relevant data.
Report details
Located below the Trending Chart, this section provides a detailed table of performance data at the user or team level for a selected date range.

Table data views
The table includes the following default columns:
- Team: The team
theuser belongs to.
- Utilization Rate: Percentage of billable hours out of total work hours.
Formula: Total billable hours / total work hours.
- Realization Rate: Percentage of billable hours billed to clients.
Formula: Total billed hours / total billable hours.
- Collected Rate: Percentage of billed hours paid by clients.
Formula: Total collected hours / total billed hours
- Billable Hours: Hours that can be billed to clients.
The table includes a summary row labeled “Total” at the top, showing aggregated data for a user.
Note: A red highlight in the utilization rate column indicates the user has not met the target.
Enable additional data
Click View Settings on the right-hand side to enable more displayed data. Select the desired data options and save to include them in the report. Once enabled, the following data becomes visible:
- Untracked rate: Measures the percentage of hours not logged in the system out of total work hours. A higher rate may indicate gaps in time recording or oversight in logging activities, suggesting a need for better tracking habits.
Formula: Total untracked hours / Total work hours.
- Non-billable rate: Represents the percentage of non-billable hours out of total work hours, showing time spent on tasks not chargeable to clients.
Formula: Total non-billable hours / Total work hours.
- Total logged hours: The sum of all recorded hours (billable and non-billable) in the system for the selected period, providing a complete view of tracked activity.
- Total work hours: The total designated work hours for the selected period, as set in the user’s settings. This serves as the baseline for rate calculations.
- Billable target: The goal for billable hours set in the user’s profile, used as a performance benchmark, and visualized as the yellow line in the trending chart.
- Department: The organizational unit or team the user is assigned to within the firm.
- Billed hours: Total hours invoiced to clients in the selected period, tied to the realization rate.
- Collected hours: Total billed hours paid by clients, forming the basis of the collected rate.
- Non-billable hours: Total hours spent on non-chargeable tasks within the selected period.
- Untracked hours: Measures the percentage of actual billable hours achieved against the billable target, assessing goal attainment.
Formula: Total billable hours / Billable target.
Customize views
Tailor the table by sorting, hiding, or pinning columns to the left. To do so, hover over the top of any column, click More Options, and select your preferred customization.

Additionally, organize data by grouping per team for a structured view.
Best practices
- Monitor regularly: Generate the report weekly or monthly to identify trends early, such as a drop in utilization rates.
- Address low utilization Rates: Focus on users with low rates (highlighted in red) and follow up to improve their billable hour allocation.
- Export data: Use the “Export” button to download the report as a CSV or Excel file for deeper analysis.
- Set achievable targets: Adjust the billable hour target (yellow line) to reflect realistic goals based on team capacity.